Air Pollution Emissions Inventory- 2022
Estimates of annual emissions of air pollutants from Dickinson College activities are presented in this inventory for the period 2008 through 2022. The estimated emissions include the criteria air pollutants nitrogen oxides (NOx), sulfur dioxide (SO2), carbon monoxide (CO), particulate matter (PM), volatile organic compounds (VOC), lead, and mercury. Emissions of carbon dioxide (CO2), nitrous oxide (N2O), methane (CH4) and other greenhouse gases are not reported here and are accounted for in Dickinson’s Greenhouse Gas Inventory.
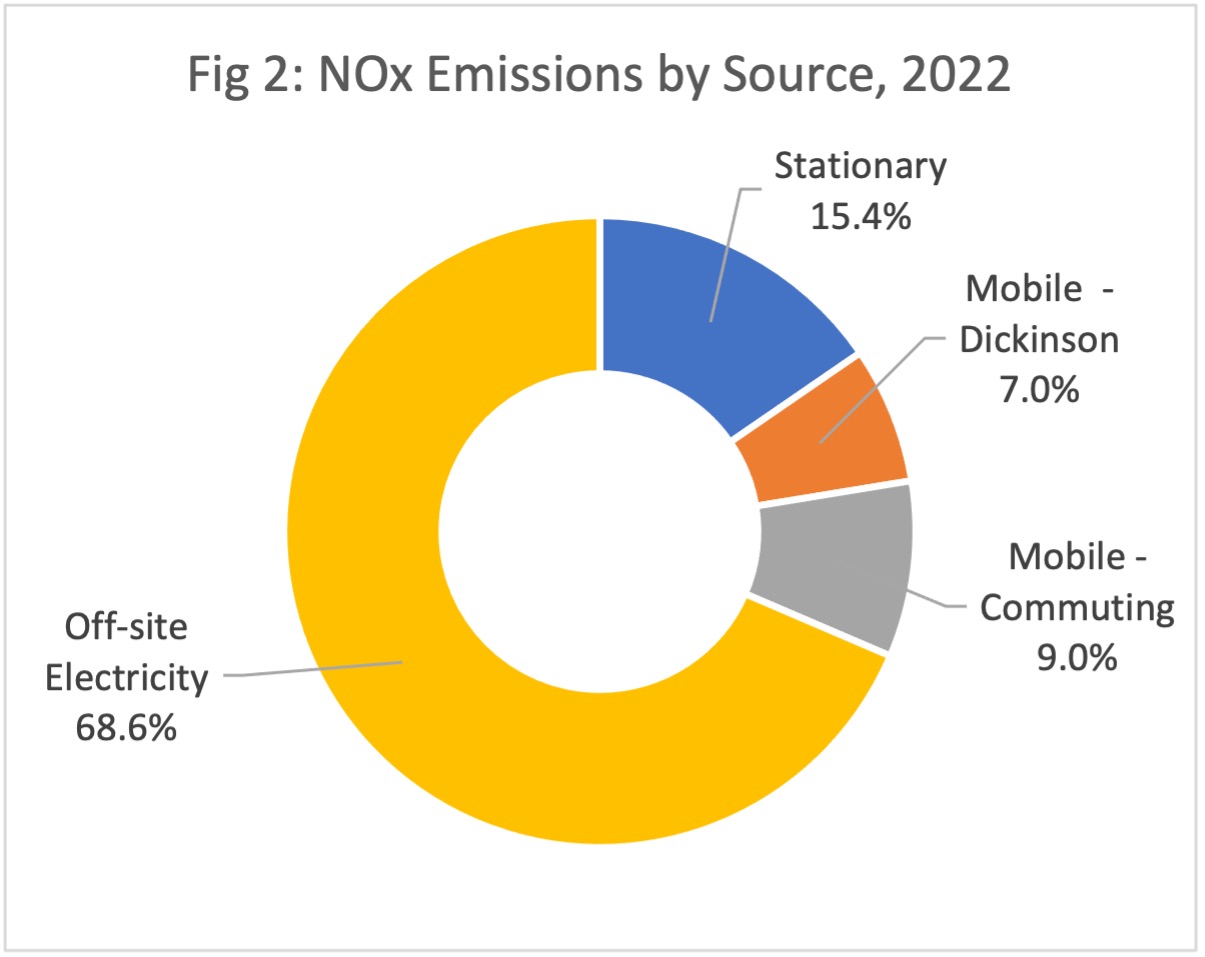
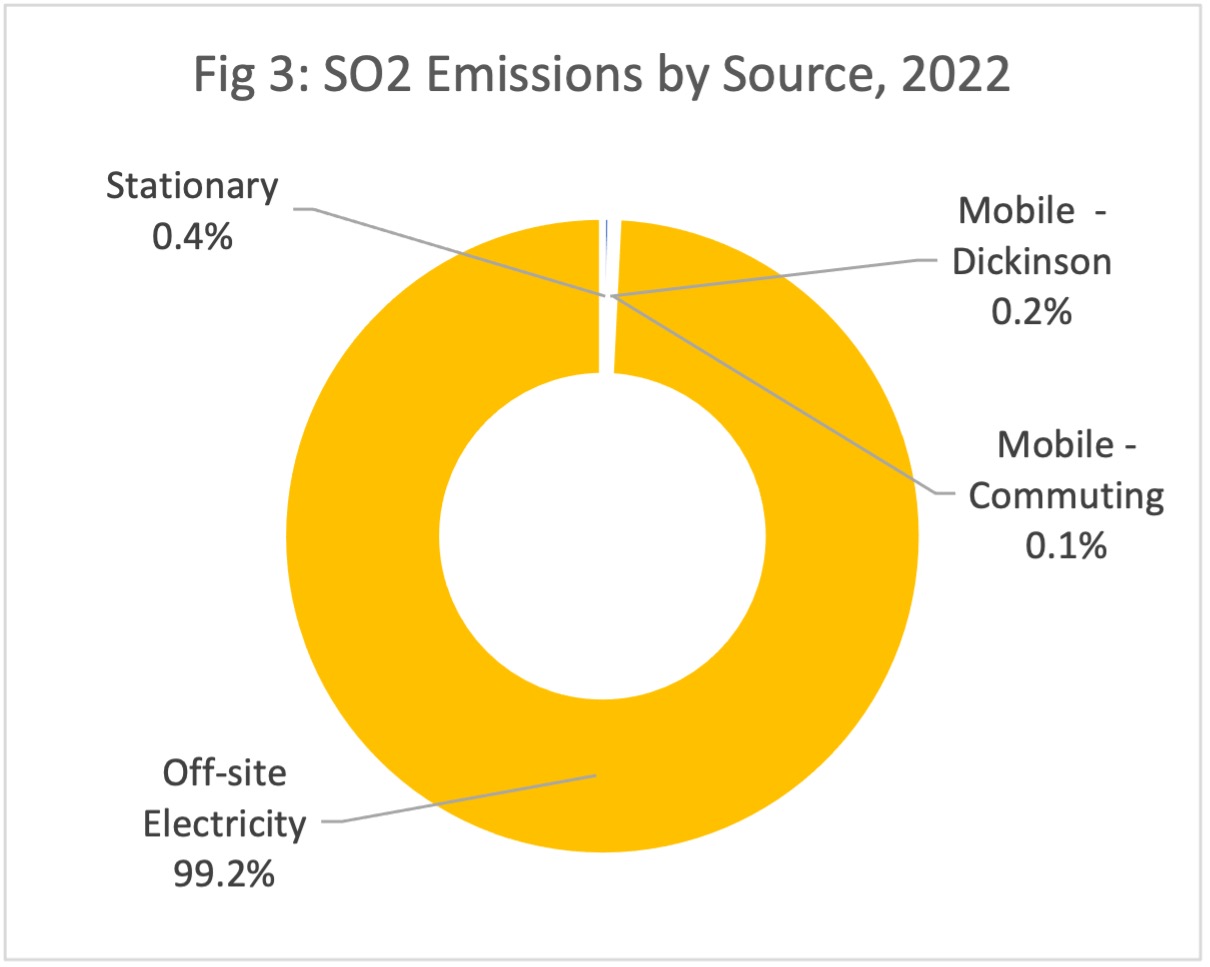
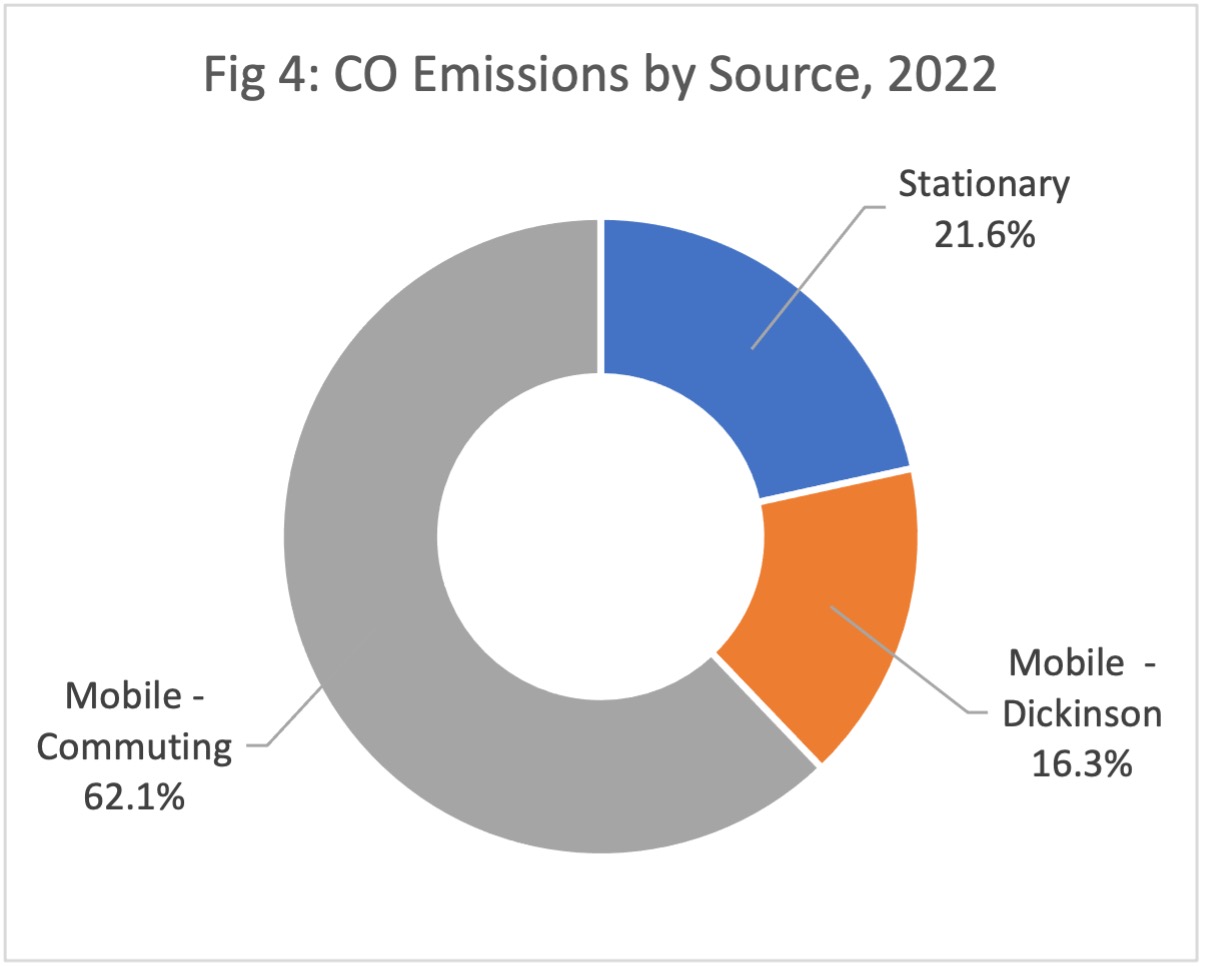
Emission sources include stationary sources, which combust natural gas and distillate oil for heating the campus, mobile sources, which combust transportation fuels for college travel and employee commuting, and offsite sources that combust various fuels to generate the electricity purchased by the college. Emissions are estimated using data for each of these activities and average emission factors. Estimates of emissions from transportation exclude air and train travel.
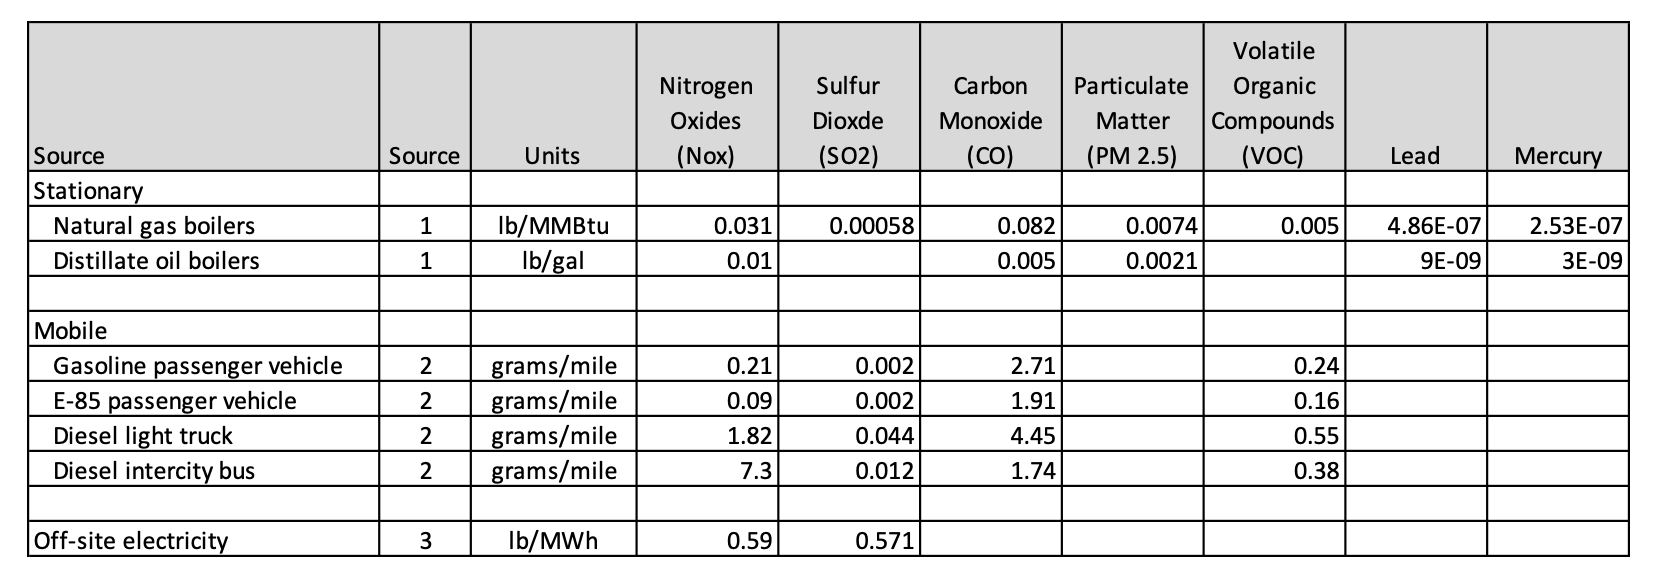
Emission factors for Dickinson’s stationary sources are derived from the USEPA’s Technology Transfer Network Clearinghouse for Inventories & Emissions Factors database (Table 1). The factors selected from the EPA database correspond to characteristics of boilers in Dickinson’s central energy plant, which produce steam and chilled water to heat and cool two-thirds of the buildings on campus, a more efficient system for heating and cooling buildings than using individual boilers and condensers. The boilers are dual-fuel 800 horsepower external combustion boilers equipped with flue gas recirculation and low NOx burners to control emissions of air pollutants. Because it is both less costly and less polluting, the boilers are run on natural gas most of the time.
Emission factors for mobile sources are derived from the USEPA’s MOtor Vehicle Emission Simulator (MOVES) and were provided by Michael Baker International, a contractor for the Tri-County Regional Planning Commission that serves Cumberland, Dauphin and Perry counties. Emission factors for offsite purchased electricity in the RFC East region are derived from the USEPA’s Emissions & Generation Resource Integrated Database (eGRID).
Table 1. Emission Factors
Sources: 1 – USEPA, Technology Transfer Network Clearinghouse for Inventories & Emissions Factors, Webfire; 2 - USEPA, MOtor Vehicle Emission Simulator (MOVES); 3 - USEPA, Emissions & Generation Resource Integrated Database (eGRID).
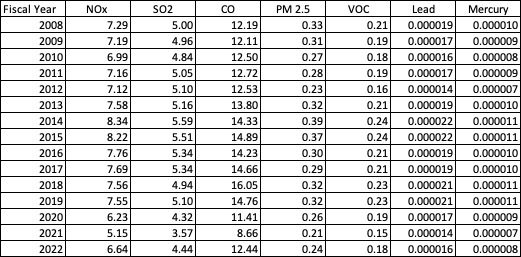
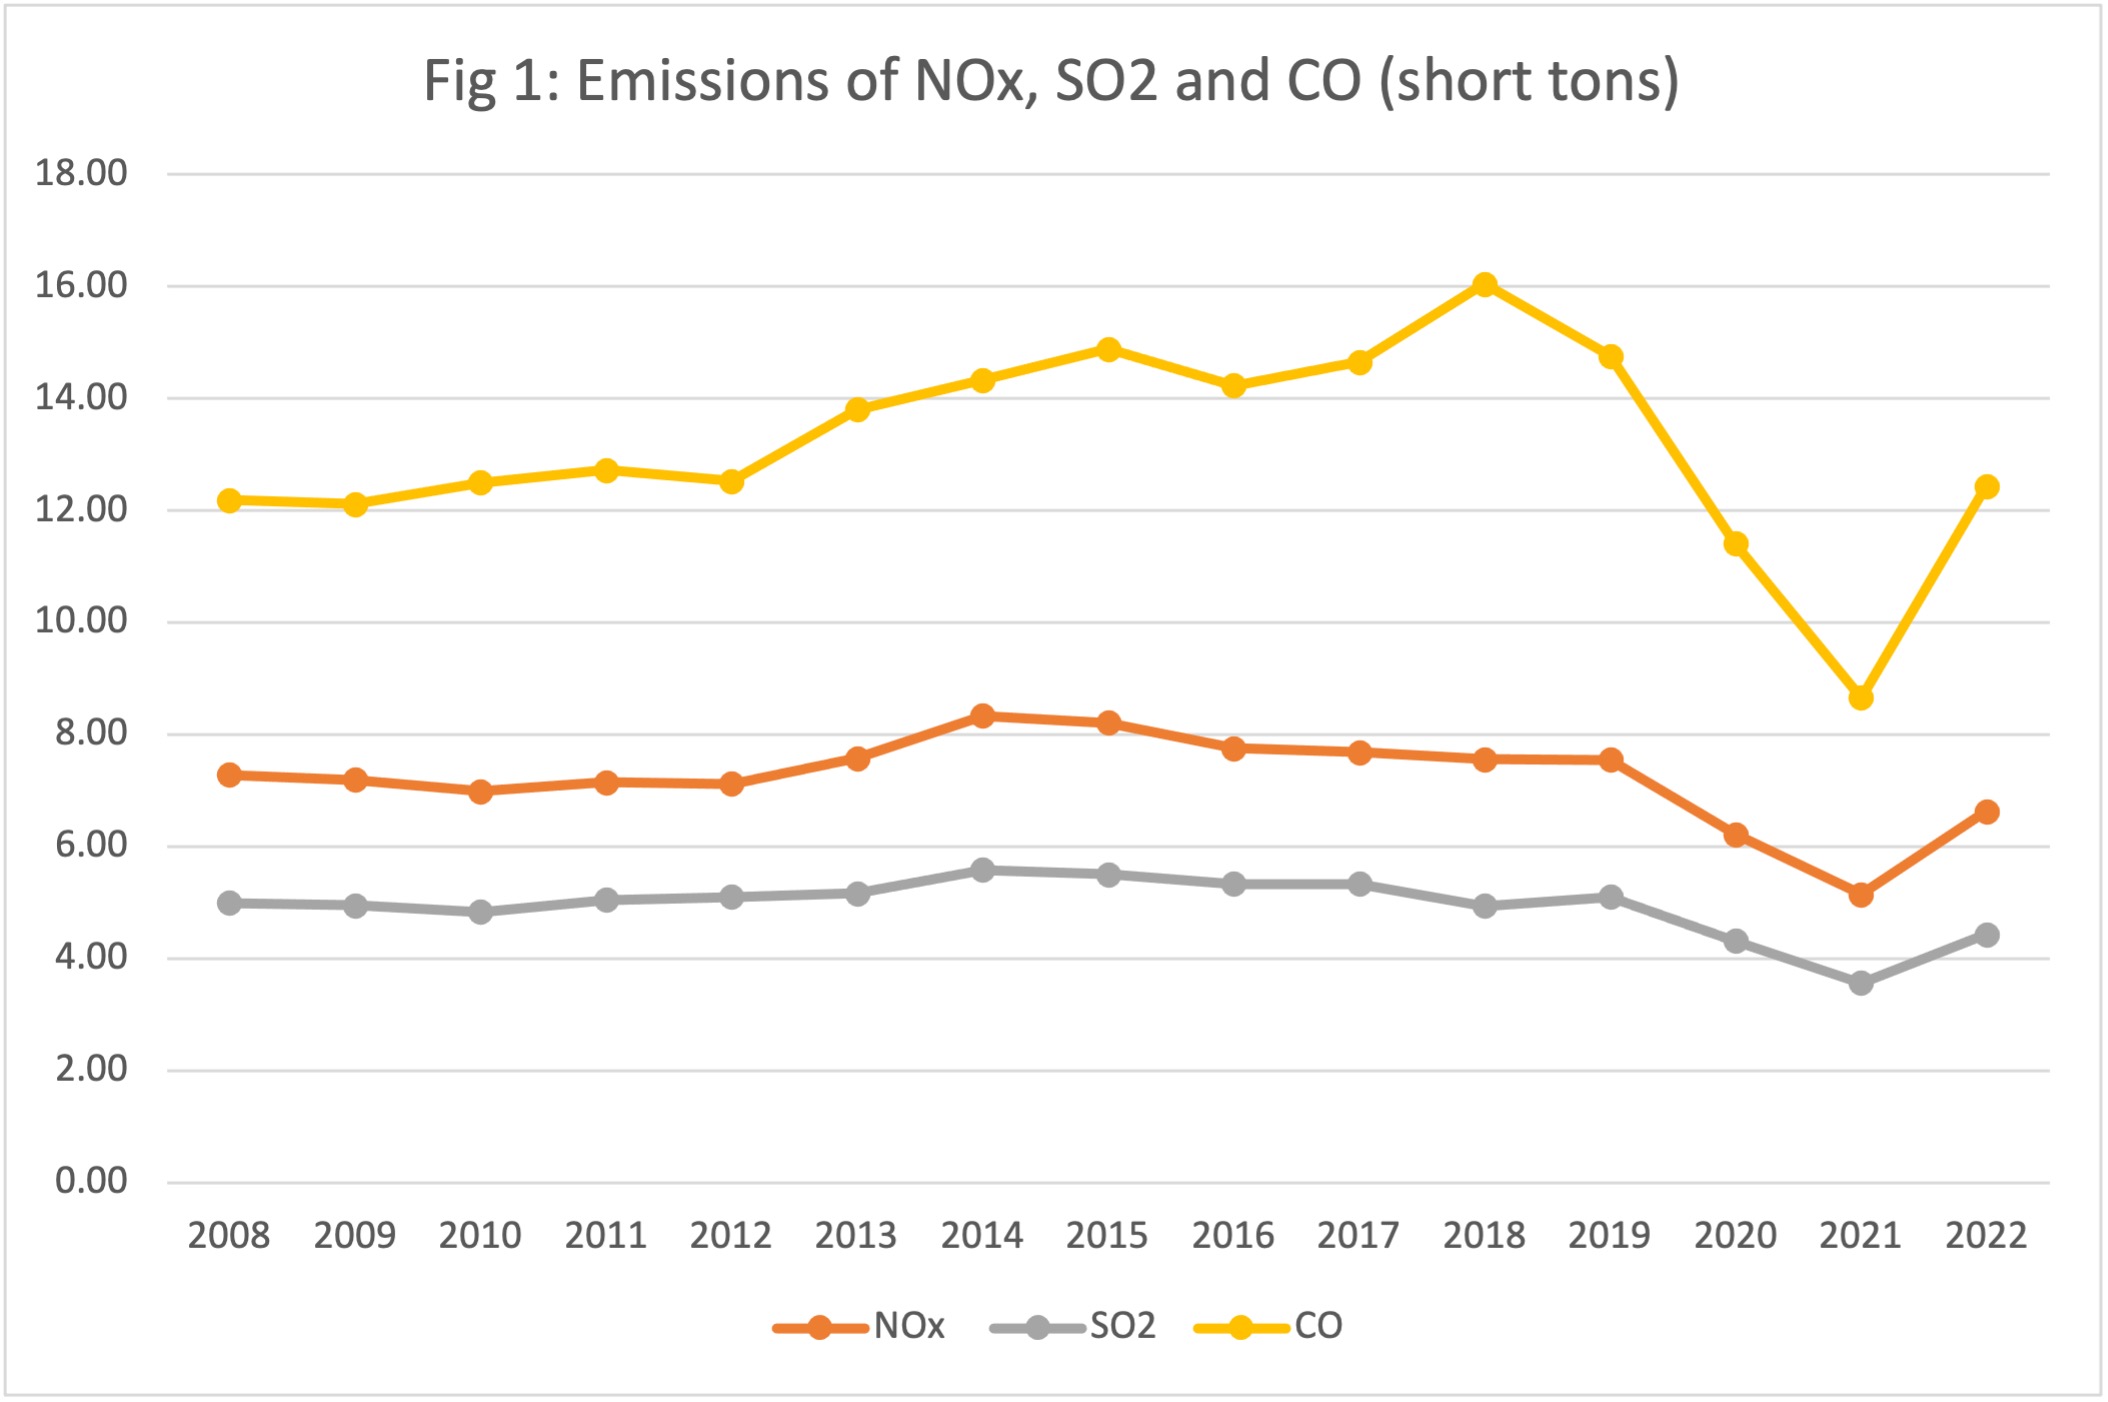
Table 2. Estimated emissions of air pollutants, 2008 - 2022 (short tons)
Prepared by: Neil Leary, Center for Sustainability Education, February 23, 2024.
References
USEPA, Emissions & Generation Resource Integrated Database (eGRID), https://www.epa.gov/egrid.
USEPA, Motor Vehicle Emission Simulator (MOVES), https://www.epa.gov/moves.
USEPA, Technology Transfer Network Clearinghouse for Inventories & Emissions Factors, https://cfpub.epa.gov/webfire/index.cfm?action=fire.detailedsearch.