Something in the Water
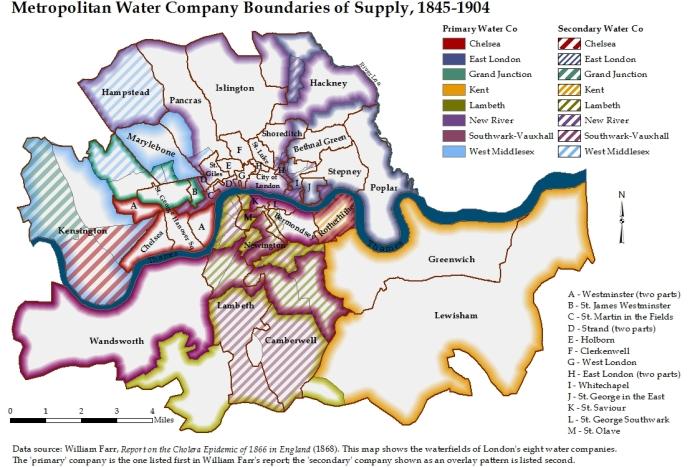
A map created for the project shows how cholera spread through London's water-supply system during the 19th century.
By Tony Moore
The Asiatic cholera epidemic that swept through London (more than once) in the middle of the 19th century was devastating, and it had people scratching their heads about what would cause such a thing to spread as it did.
At the time, two individuals vied to put forth the most sensible explanation for the rampant spread of the disease: John Snow, an esteemed scientist, and William Farr, of London's Office of the Registrar General. In short, Snow thought it had something to do with the water supply, while Farr had a hunch that elevation played the key role. Wait, elevation?
No, not elevation
"Looking at the argument now, 150 years later, it's easy to say, 'Farr was a fool; Snow was right,' " says Associate Professor of Economics Nicky Tynan with a laugh. "But now we can show that Snow's argument wasn't obviously correct when he first made it."
"Every time I present this [water-supply information] to an audience, usually economists who aren't familiar with London, they struggle to envision overlapping water-supply networks," Tynan explains. "They say, 'If only we had a map!' "
Enter Jim Ciarrocca, Dickinson's GIS specialist. He put Tynan in touch with Cicak, who was then taking an advanced GIS course, to set up a mapping-based internship.
Digital cartography
"I majored in archaeology and anthropology, and historical mapping was something I was really interested in," says Cicak. So she began gathering maps—mostly historical maps from the 1800s—to represent the data. "They had missing districts, or district lines would have been redrawn, so figuring out how to turn these paper maps into digital versions was a wonderful challenge," she says, noting that she ended up hand-tracing thousands of contour lines.
Something else researchers will be able to access is the paper that emerged from the project, which has been accepted, without revisions (a rare occurrence), by The London Journal for its March 2015 issue. By the time the article is published, Cicak will likely be enmeshed in postgraduate studies, something she says will stem directly from the project at hand.
"I want to go to grad school and eventually use unconventional applications of GIS in anthropology," says Cicak, who is currently a special-project assistant in the Waidner-Spahr Library. "So this project really directed where I want to go with future research and what I want to do later in life."
Read more:
Dickinson's Department of Economics
Published September 20, 2013