Taming the Digital Frontier
Digital Boot Camps students presented their projects during a showcase in the Waidner-Spahr Library.
From sci-fi to Shakespeare, students use digital tools to analyze, present data visually
by MaryAlice Bitts-Jackson
Never before have academia, business, government and industry packed such an abundance of potentially useful information in their holsters, just waiting to be drawn. The big question of the 2010s: How to navigate the Wild West of big data? Students who took part in Dickinson's third annual Digital Boot Camp now have an excellent road map and compelling experience in the field.
Funded by a grant from the Andrew W. Mellon Foundation and led by Patrick Belk, postdoctoral fellow in digital humanities, Digital Boot Camp is a hands-on training program that helps students develop the digital skills and best-practice knowledge they need to optimally display, manage and analyze media and information in the digital age.
“I’m planning for a career in social science, and all of us are looking for ways to show qualitative analysis,” said Kayla Kahan ’18 (environmental studies, sociology). “So when I heard about the boot camp, I knew I wanted to be involved.”
After a week and a half of learning the fundamentals of Drupal, ArcGIS (Geographic Information Systems) and Gephi (open-source data visualization), the students tapped that new knowledge to sift through and analyze data supplied by faculty members as well as library and archives staff. Students then presented their online projects in the Waidner-Spahr Library on Feb. 11.
Amazing by the numbers
Max Burrows ’19 and Devji Ndreca ’19 used text-analysis programs TextSTAT, Notepad++ and Stanford POS Tagger to better understand 20th-century science-fiction literature published in Amazing Stories magazine, and then transformed their raw data into images, using a graphing program, Gephi.
Their work took into account not just word frequencies, but also the connections between those words and the themes they represent, and they noted changes in the most-repeated words and in predominant sci-fi themes over time.
Picturing the Indian School
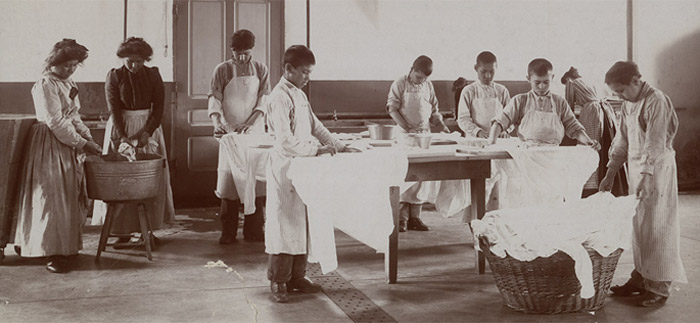
Kahan worked with Sarah Goldberg ’18 (history) to cull and present data relating to the Carlisle Indian Industrial School.
Using the Topic Modeling Toolbox to analyze more than 50 Carlisle publications in Dickinson’s archives & special collections, including The Red Man and The Indian Craftsman, Kahan and Goldberg curated a selection of photographs to tell the Carlisle Indian Industrial School story and selected quotations from the publications’ text to add context to the images. They also used Carlisle Indian Industrial School ledgers to extract information about institutional and student demographics and created graphs and images to visually present student age ranges, the locations of school outings, the students' nations and expelled students' nations.
Visualizing Black Milwaukee
Chunlin Zhu ’18 (computer science) and Aditi Joshi ’19 (computer science, mathematics) took their technical expertise to new avenues when they used Drupal, ArcGIS and Palladio to organize and analyze data on the African American population in midcentury Milwaukee.
Their website, Black Milwaukee, includes a brief history and timeline, maps of African American businesses through the years and a gallery of archival photos from 1950 to 1965.
6,000 lemmas
Fellow class of 2019 members Connor Ford and Seth Levin (classical studies) put a professor’s skills to the test when they analyzed the language used in Virgil’s Aeneid and compared their findings with a list of 1,000 Latin lemmas, or commonly used Latin root words, developed by Christopher Francese, Asbury J. Clarke Professor of Classical Studies.
“The idea is that there is a relatively small number of high-frequency lemmas that account for a high percentage of word forms in a typical text, so if you learn those 1,000 core words, you should be able to understand most of a text,” Levin explained. So they took all 66,000 words in the Aeneid—which included 6,000 unique words—and used Excel and Tableau to graph the words by frequency and parts of speech.
The top adjectives (“large,” “every,” “grave”) and nouns (“fight,” “weapons”) did not surprise them, as the text depicts the Trojan War. As for the lemmas, “It’s neat to see how much you can understand if you only know the core 1,000 words,” said Ford, adding that words on the professor’s list made up about 80 percent of the classic text, and that the only word in the top 100 most frequently used that is not found in Francese’s list is the self-explanatory exclamation “O!”
Mapping Shakespeare
Katie Lasswell ’17 (English, medieval & early modern studies) and Leigh Tracey ’17 (English) made all of Shakespeare’s texts available and searchable by category (tragedy, comedy, history), connecting each digitized play with a scanned image of the text on the page. Then they mapped out the settings of each play—exact and approximated—and presented graphs to lay out the number of speeches by each major character and the average number of words per speech by play, and by play category.
“The overall goal was to approach a familiar text in a different way,” said Lasswell, a digital-humanities intern who specializes in medieval literature and is enjoying the collision of those two worlds. “This project definitely allows us to approach familiar text in a different way, in addition to close reading.”
Learn more
- Digital Humanities
- "Learning From the Past" (Sarah Goldberg '18)
- “Visualize”
- “Less Yak, More Hack”
- Latest News
Published February 22, 2016